Biodiversity Net Gain Infographics


As part of UKGBC’s ongoing project on Biodiversity Net Gain, these infographics examine the intrinsic value of nature while demonstrating the impact of the built environment as an industry on the UK’s biodiversity. They also map the links between biodiversity and other socio-economic priorities to tell a broader story about how we should view nature as a foundational element of our economy and society.
The infographics also explain the differences between BNG, which focuses primarily on habitats, and other key concepts like Environmental Net Gain (ENG), which focuses on systems and outcomes, and the Environmental Impact Assessments.
Understanding these concepts and their relative importance for different areas of design and construction in the built environment will enable and encourage businesses to – independently of Government action or legislation – implement solutions that enrich the natural world in early design and strategy stages.
Who are these infographics for?
Built environment practitioners designing, building or developing projects
Built environment and policy professionals
Download the Infographics here
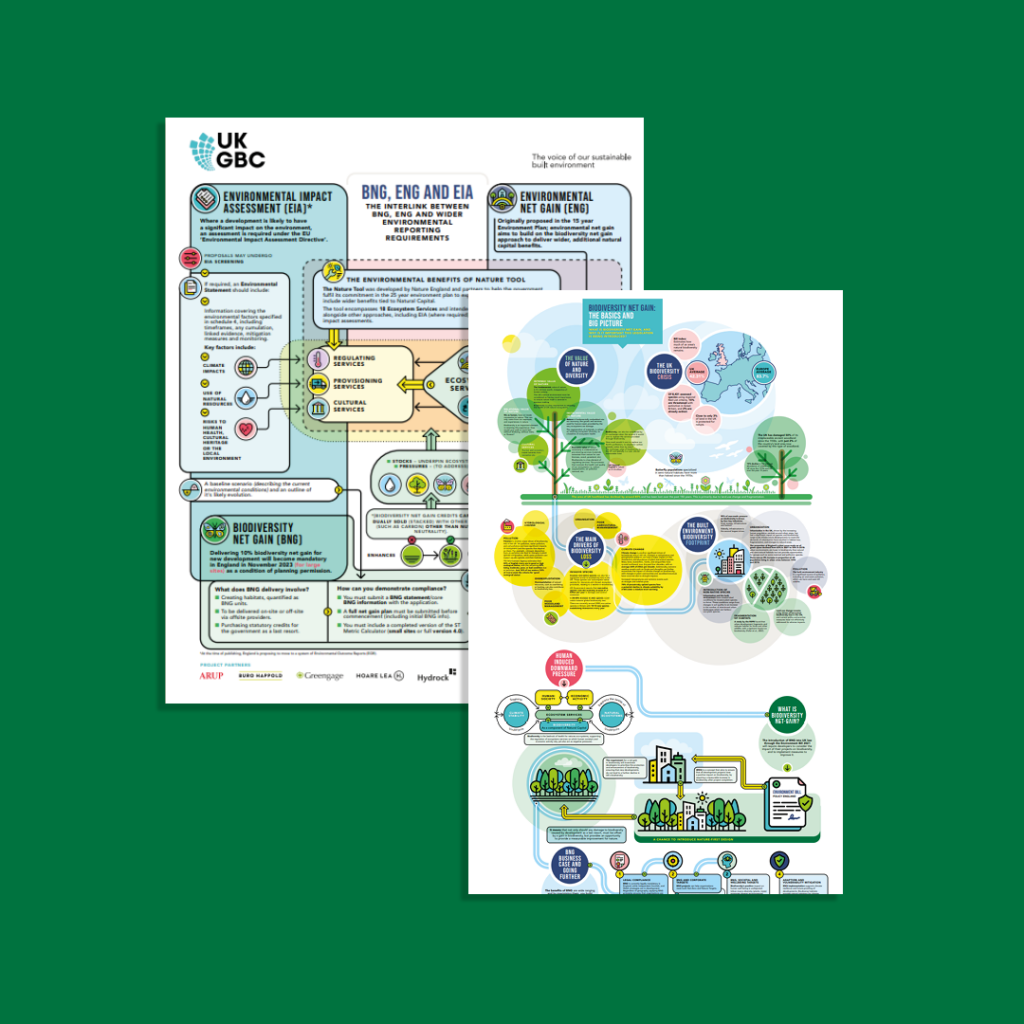
Biodiversity Net Gain: The basics and the big picture
Comparing BNG, ENG and EIA
Nature Programme Partners
With thanks to our programme partners who make our work on nature possible.


Biodiversity and Environmental Net Gain Project Partners
Our work on Biodiversity Net Gain and Environmental Gain is generously supported by the following organisations.


Biodiversity/ Environmental Net Gain


Related
Biodiversity Net Gain Factsheets


UKGBC responds to consultation on biodiversity Net Gain Regulations and Implementation


Investing in a Greener Greater Manchester: A nature-based solutions investment guide for local authorities

The Value of Urban Nature Based Solutions

