Infographic
Discover all of UKGBC's Infographics.
What does UKGBC mean by Infographic?
These are short snappy resources, that share key insights and research for different audiences. They’re designed to give a shot of inspiration, or summarise the key information from a UKGBC project or report.
Infographics are often a first port-of-cool for understanding a topic, or sharing a set of sustainability ideas with your team.
Filter
Biodiversity Net Gain Infographics
Two infographics designed to demystify key concepts related to Biodiversity and Environmental Net Gain – particularly on the process of its implementation and the overlap between various nature policies.


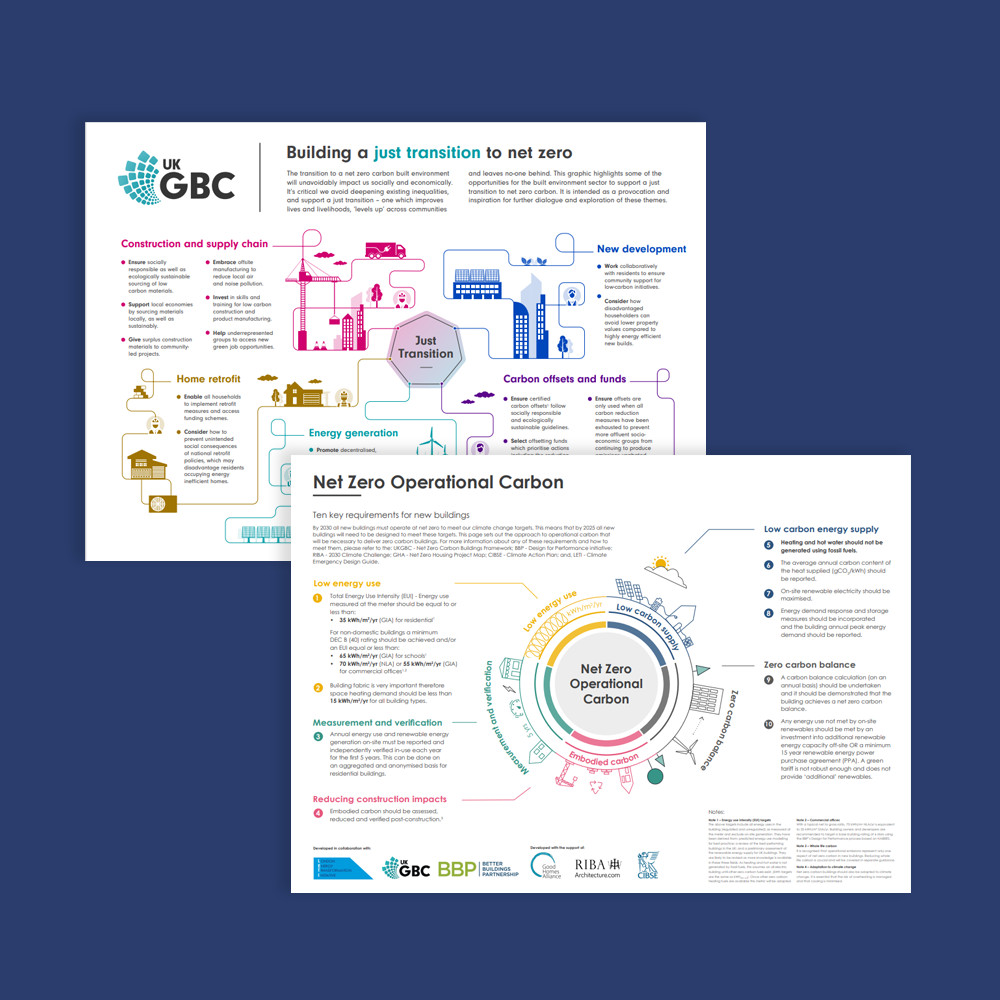
Building a Just Transition to Net Zero: one-pager
As the UK built environment looks towards delivering net zero carbon, this infographic sets out some important considerations to ensure a just transition


Interactive Policy Map
This interactive map highlights leading examples of domestic retrofit and new home policies and initiatives from local and combined authorities across the UK.


Net zero carbon: one-pager for new buildings
This one-pager sets out the 10 key features required for a new building to achieve net zero carbon in operation.


4 results found
Showing page 1 of 1
Our Resources
Discover our range of resources, developed by our team of sustainability experts.